


.png)

%20(1).png)
.png)

Pest Species Trend Analysis - Audited Pest Management & Accreditations......
- Atlas Environmental Services

- Mar 16
- 2 min read
𝗧𝗵𝗲 𝗜𝗺𝗽𝗼𝗿𝘁𝗮𝗻𝗰𝗲 𝗢𝗳 𝗧𝗿𝗲𝗻𝗱 𝗔𝗻𝗮𝗹𝘆𝘀𝗶𝘀 𝗗𝗮𝘁𝗮 𝗙𝗿𝗼𝗺 𝗣𝗲𝘀𝘁 𝗠𝗼𝗻𝗶𝘁𝗼𝗿𝗶𝗻𝗴 𝗗𝗲𝘃𝗶𝗰𝗲𝘀.......
ℹ️ - Inspecting and documenting our findings and analysis of Monitoring Devices and Control Points remains a crucial, imperative and vital part of our sophisticated Audited Pest Management Systems at our clients Accredited Sites!
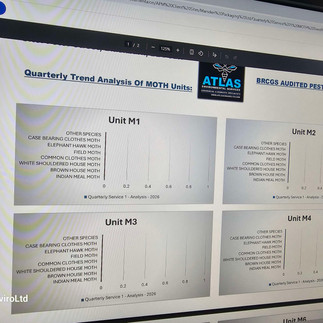
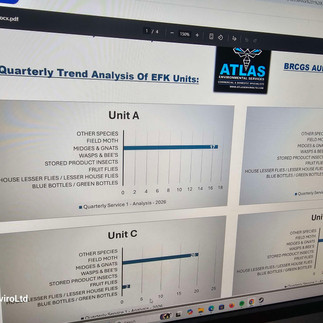
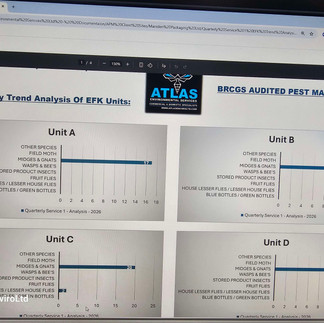
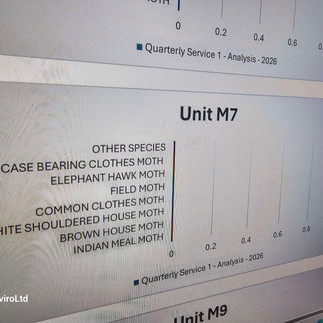
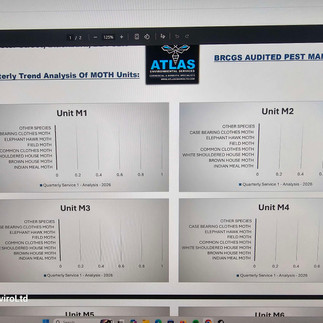
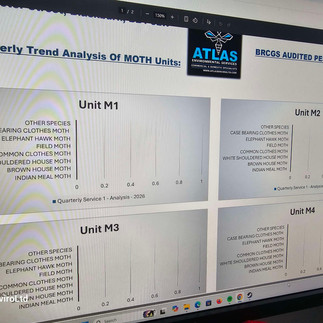
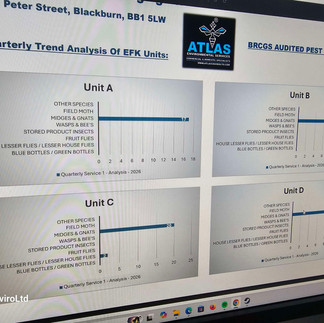
ℹ️ - Constructing strategic Trend Analysis Graphs enables ourselves, our clients and the sites auditors to assess Pest Trends and Patterns throughout a yearly and quarterly period and ensures that we can spot patterns, evaluate the effectiveness of control strategies, and move from reactive Pest Management to proactive prevention plans when required!
𝙆𝙚𝙮 𝙧𝙚𝙖𝙨𝙤𝙣𝙨 𝙛𝙤𝙧 𝙪𝙨𝙞𝙣𝙜 𝙩𝙧𝙚𝙣𝙙 𝙖𝙣𝙖𝙡𝙮𝙨𝙞𝙨 𝙜𝙧𝙖𝙥𝙝𝙨 𝙞𝙣 𝙋𝙚𝙨𝙩 𝙈𝙖𝙣𝙖𝙜𝙚𝙢𝙚𝙣𝙩 𝙞𝙣𝙘𝙡𝙪𝙙𝙚:
𝗣𝗿𝗼𝗮𝗰𝘁𝗶𝘃𝗲 𝗥𝗶𝘀𝗸 𝗥𝗲𝗱𝘂𝗰𝘁𝗶𝗼𝗻:
By identifying trends — Such as a rise in Rodent activity over several weeks —Ourselves can then take preventative action before a minor problem turns into a major infestation.
𝗘𝘃𝗮𝗹𝘂𝗮𝘁𝗶𝗼𝗻 𝗼𝗳 𝗖𝗼𝗻𝘁𝗿𝗼𝗹 𝗘𝗳𝗳𝗲𝗰𝘁𝗶𝘃𝗲𝗻𝗲𝘀𝘀:
Our Graphs show whether ongoing Pest Management programs are working correctly and adequately. If a trend line for Pest's captured is not decreasing after treatment procedures, the strategies and control methods require immediate responses and remedies!
𝗜𝗱𝗲𝗻𝘁𝗶𝗳𝗶𝗰𝗮𝘁𝗶𝗼𝗻 𝗼𝗳 𝗛𝗼𝘁 𝗦𝗽𝗼𝘁𝘀:
Trend graphs can visualise where Pest activity is the highest within a facility, enabling targeted maintenance or sanitation efforts, rather than wasting resources treating the entire premises.
𝗥𝗲𝗴𝘂𝗹𝗮𝘁𝗼𝗿𝘆 𝗖𝗼𝗺𝗽𝗹𝗶𝗮𝗻𝗰𝗲:
In industries like food manufacturing, trend analysis is a requirement for audits (such as BRCGS or AIB). The graphs provide documented, visual evidence of Monitoring, Preventative and Control efforts to auditors.
𝗥𝗼𝗼𝘁 𝗖𝗮𝘂𝘀𝗲 𝗔𝗻𝗮𝗹𝘆𝘀𝗶𝘀:
When plotted against environmental factors (e.g., rainfall, temperature) or internal conditions (e.g., failed sanitation), trend graphs help determine why a pest problem may have occurred, rather than just treating the symptoms.
𝗗𝗮𝘁𝗮-𝗗𝗿𝗶𝘃𝗲𝗻 𝗗𝗲𝗰𝗶𝘀𝗶𝗼𝗻 𝗠𝗮𝗸𝗶𝗻𝗴:
Visual data helps in making informed decisions about whether to increase the frequency of inspections, change chemical baits, or alter structural barriers (Proofing) and reducing reliance on unnecessary pesticide usage.
ℹ️ - When conducting site survey inspections at new clients sites that are audited to strict criterias we often find that Trend Analysis files have been overlooked and and not completed in accordance to the sites servicing schedules, this then leads to non conformances and can seriously affect the Accreditation Criterias!
ℹ️ - Here at ATLAS Environmental Services Ltd ®️ we always ensure that our findings are documented clearly and precisely leading to no non conformances or our clients requesting these documents from ourselves which are delivered into their online site portal systems after our servicing and site assessments have been performed!
" The North West's Solution for BRCGS Audited Pest Management Systems "


Comments